This data visualization project was created as part of the MA Information Design program at the University of Reading. The project focuses on using data visualization as a way to prevent the spread of hospital-acquired illnesses.
My research found that lack of hand hygiene in medical settings is a significant issue. Improper hand hygiene can lead to infections, causing a significant health threat and financial burden. The deliverables for this project focus on improving hand hygiene through education about harmful pathogens. Two audiences were considered: a general audience (typical visitors in healthcare settings) and a specialized audience (health care workers). A closer look at the brief, research, and process can be seen in the Data Project Report.
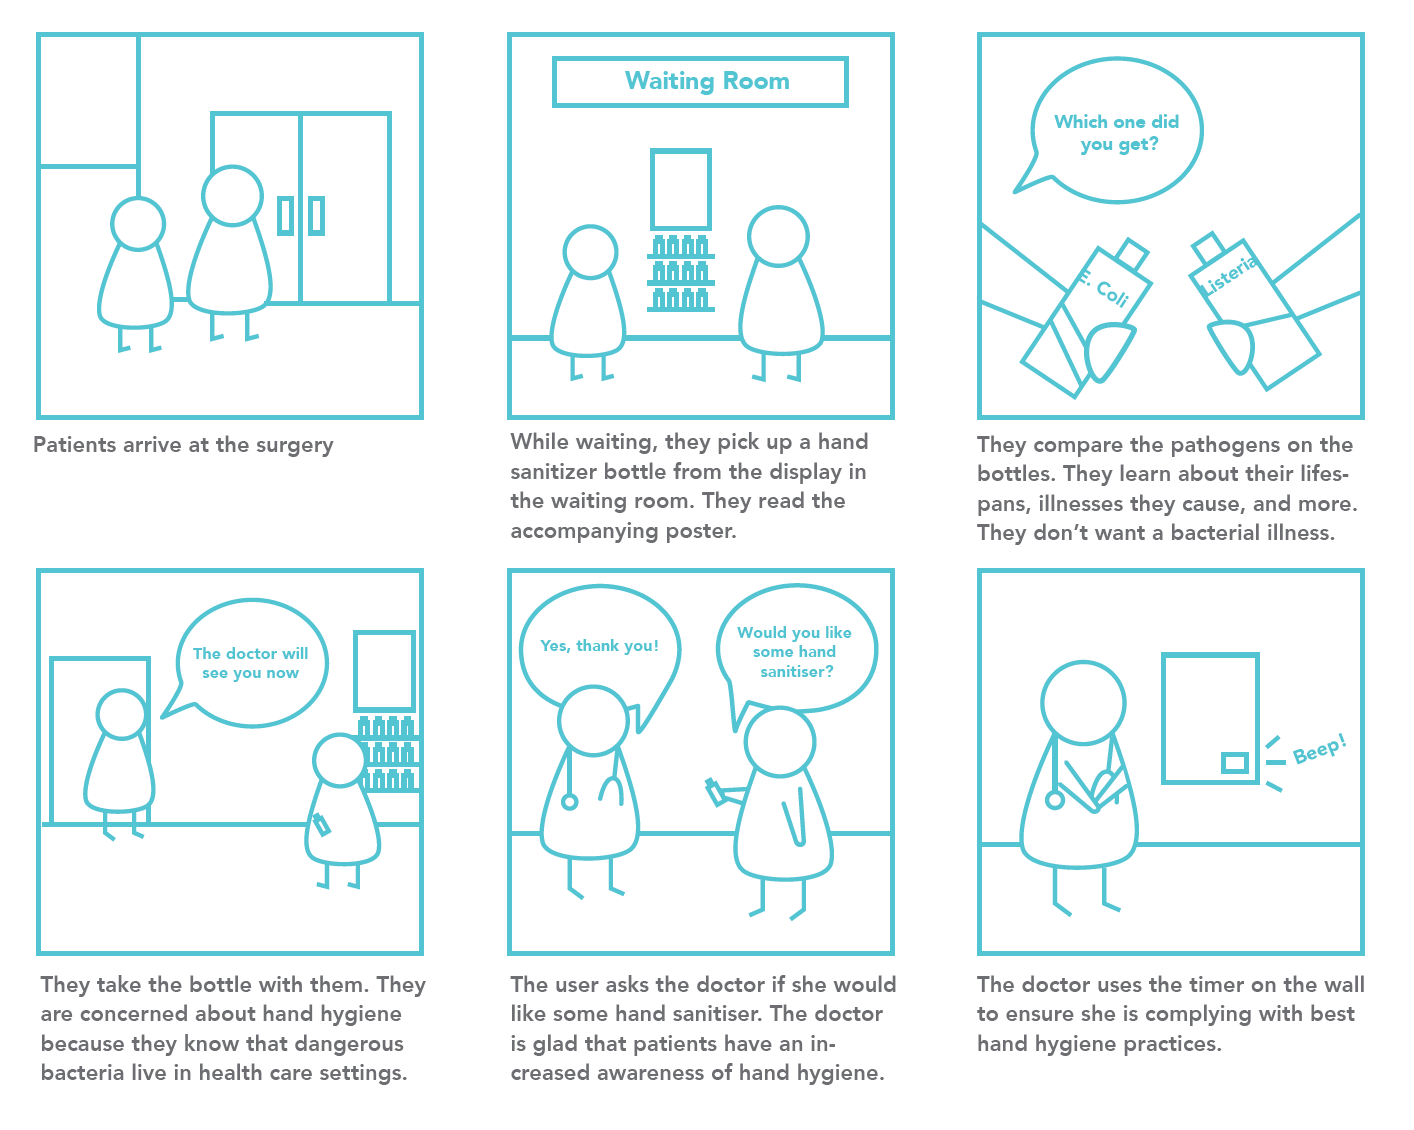
Storyboard showing the user journey

Early design for hand sanitizer bottles. This design was ultimately changed because it was not appropriate for a general audience (too uninviting and technical looking).
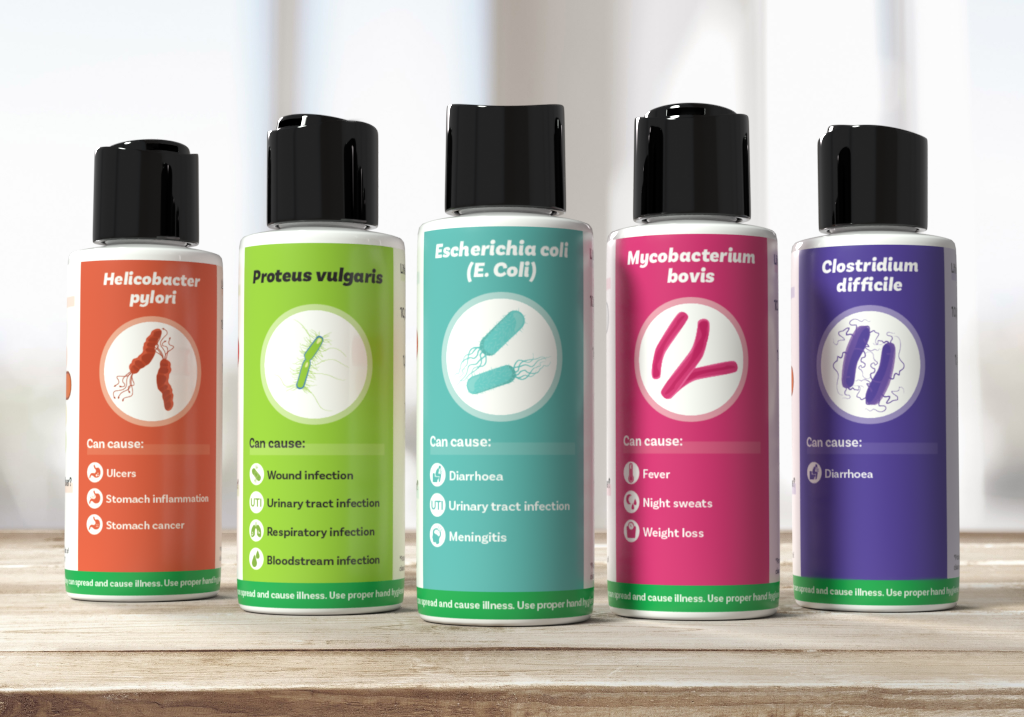
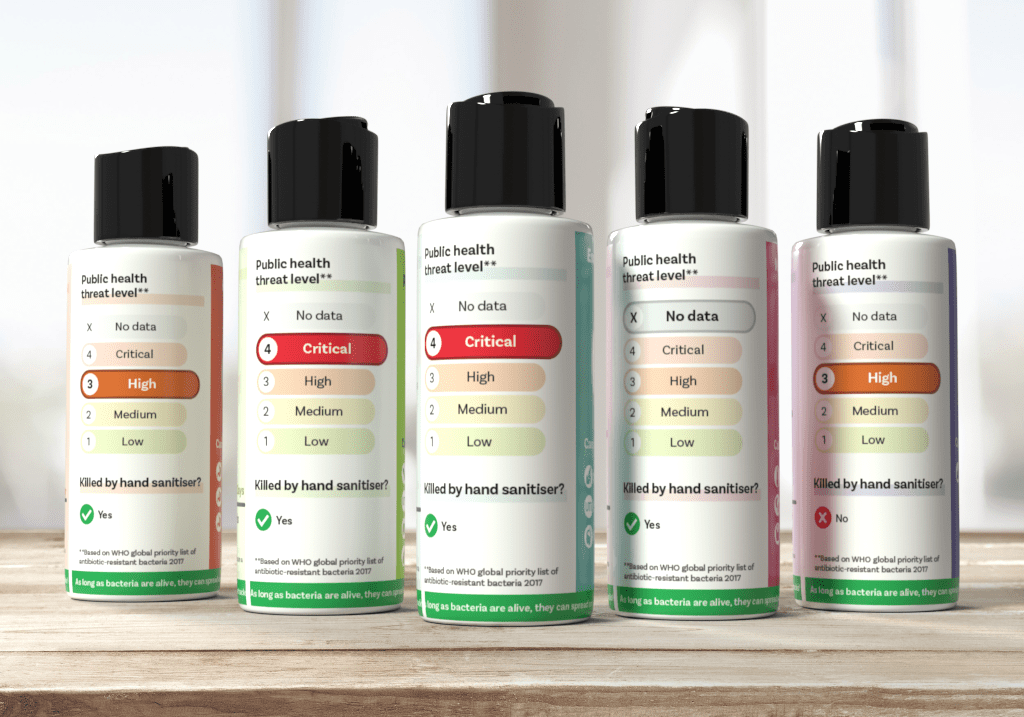
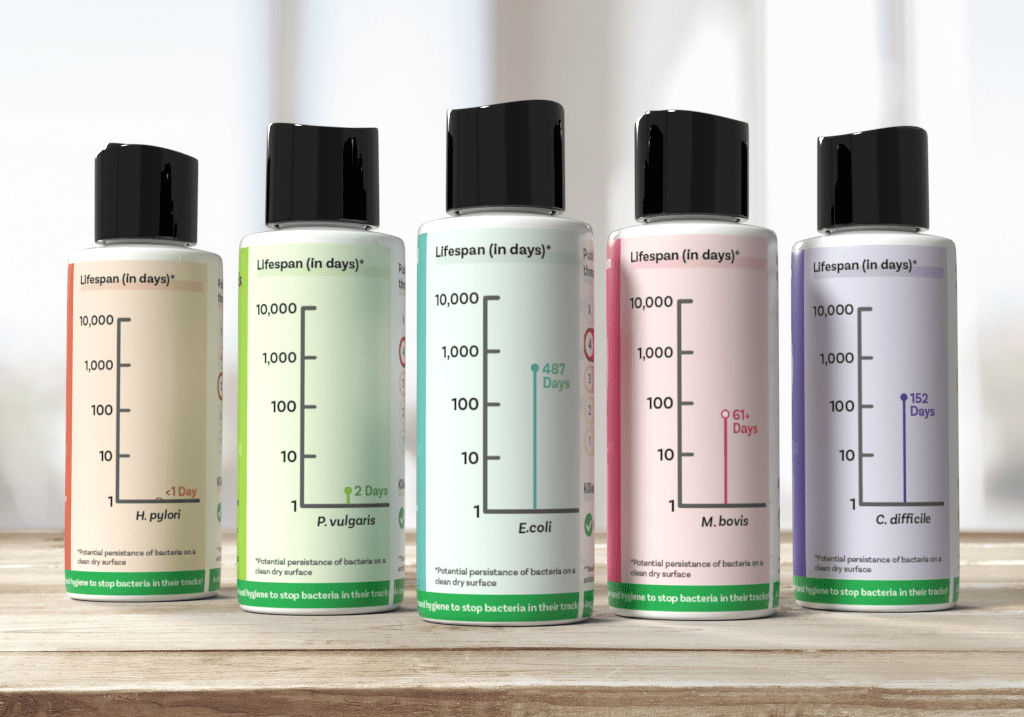
Sample of five final designs for hand sanitizer bottles. Each bacteria has its own color, and as a set (28 bottles), they would create a visually interesting display for a general audience.
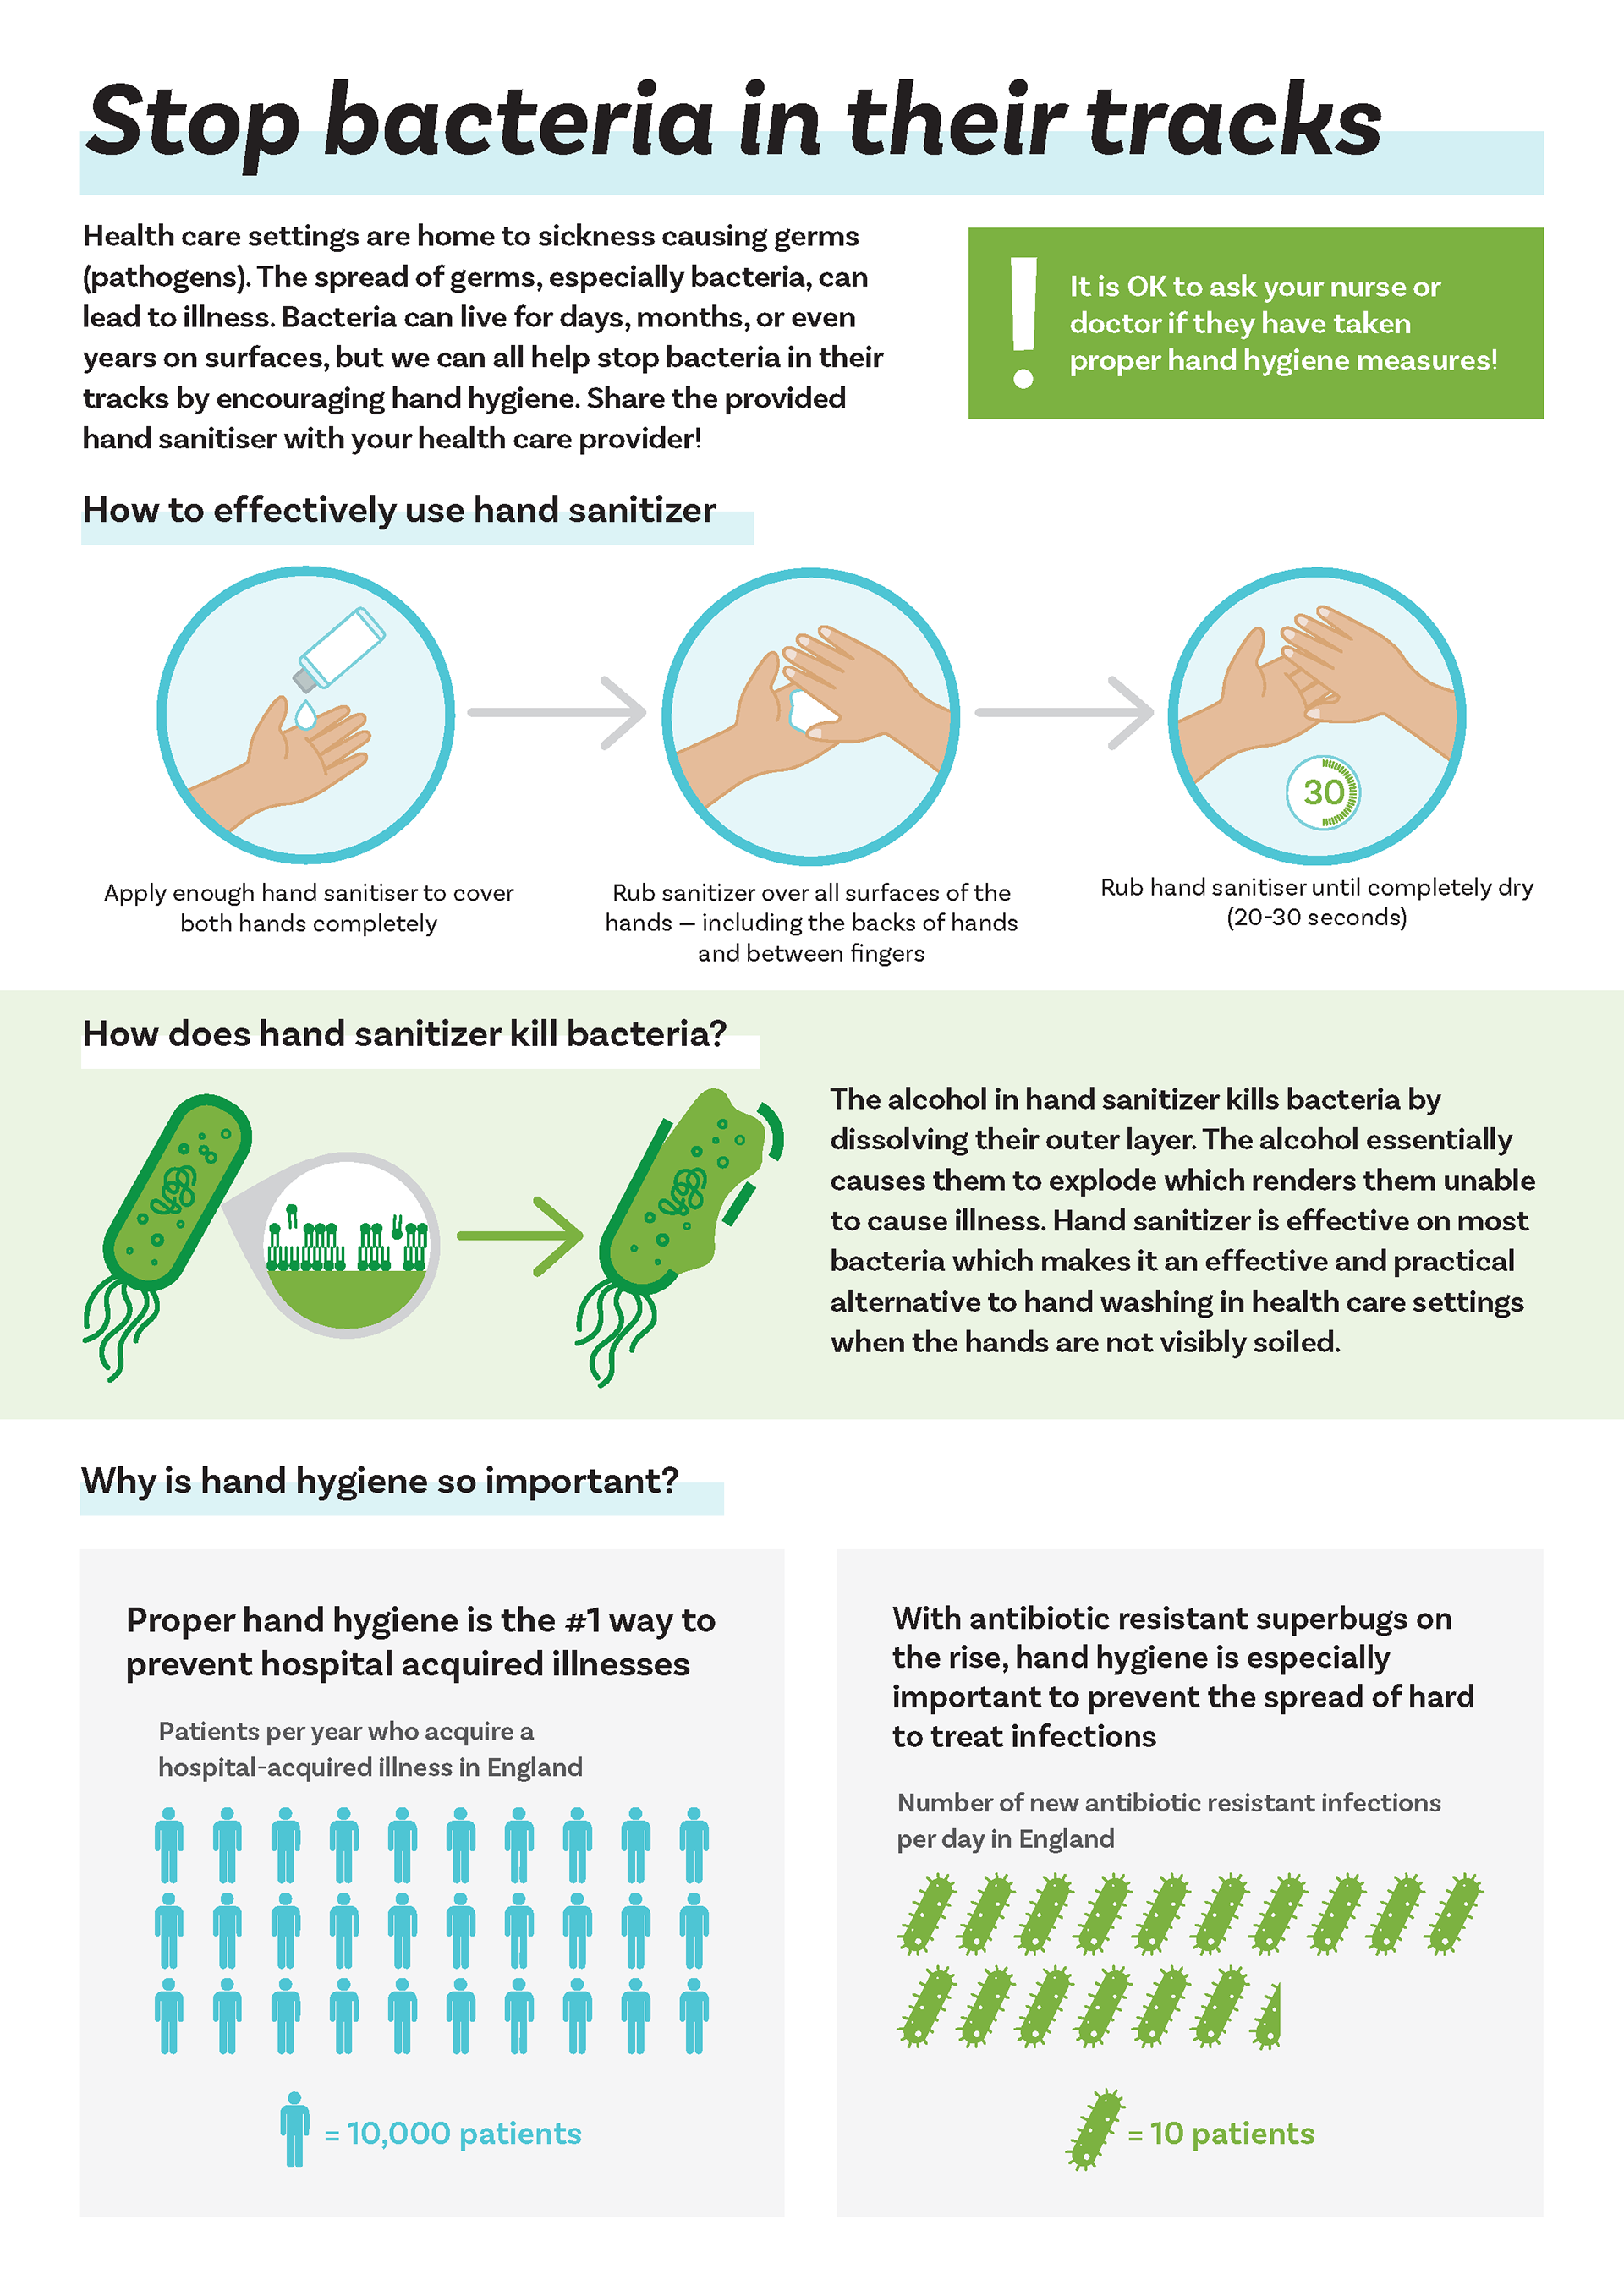
Infographic explaining how proper hand hygiene can help prevent the spread of hospital acquired illnesses
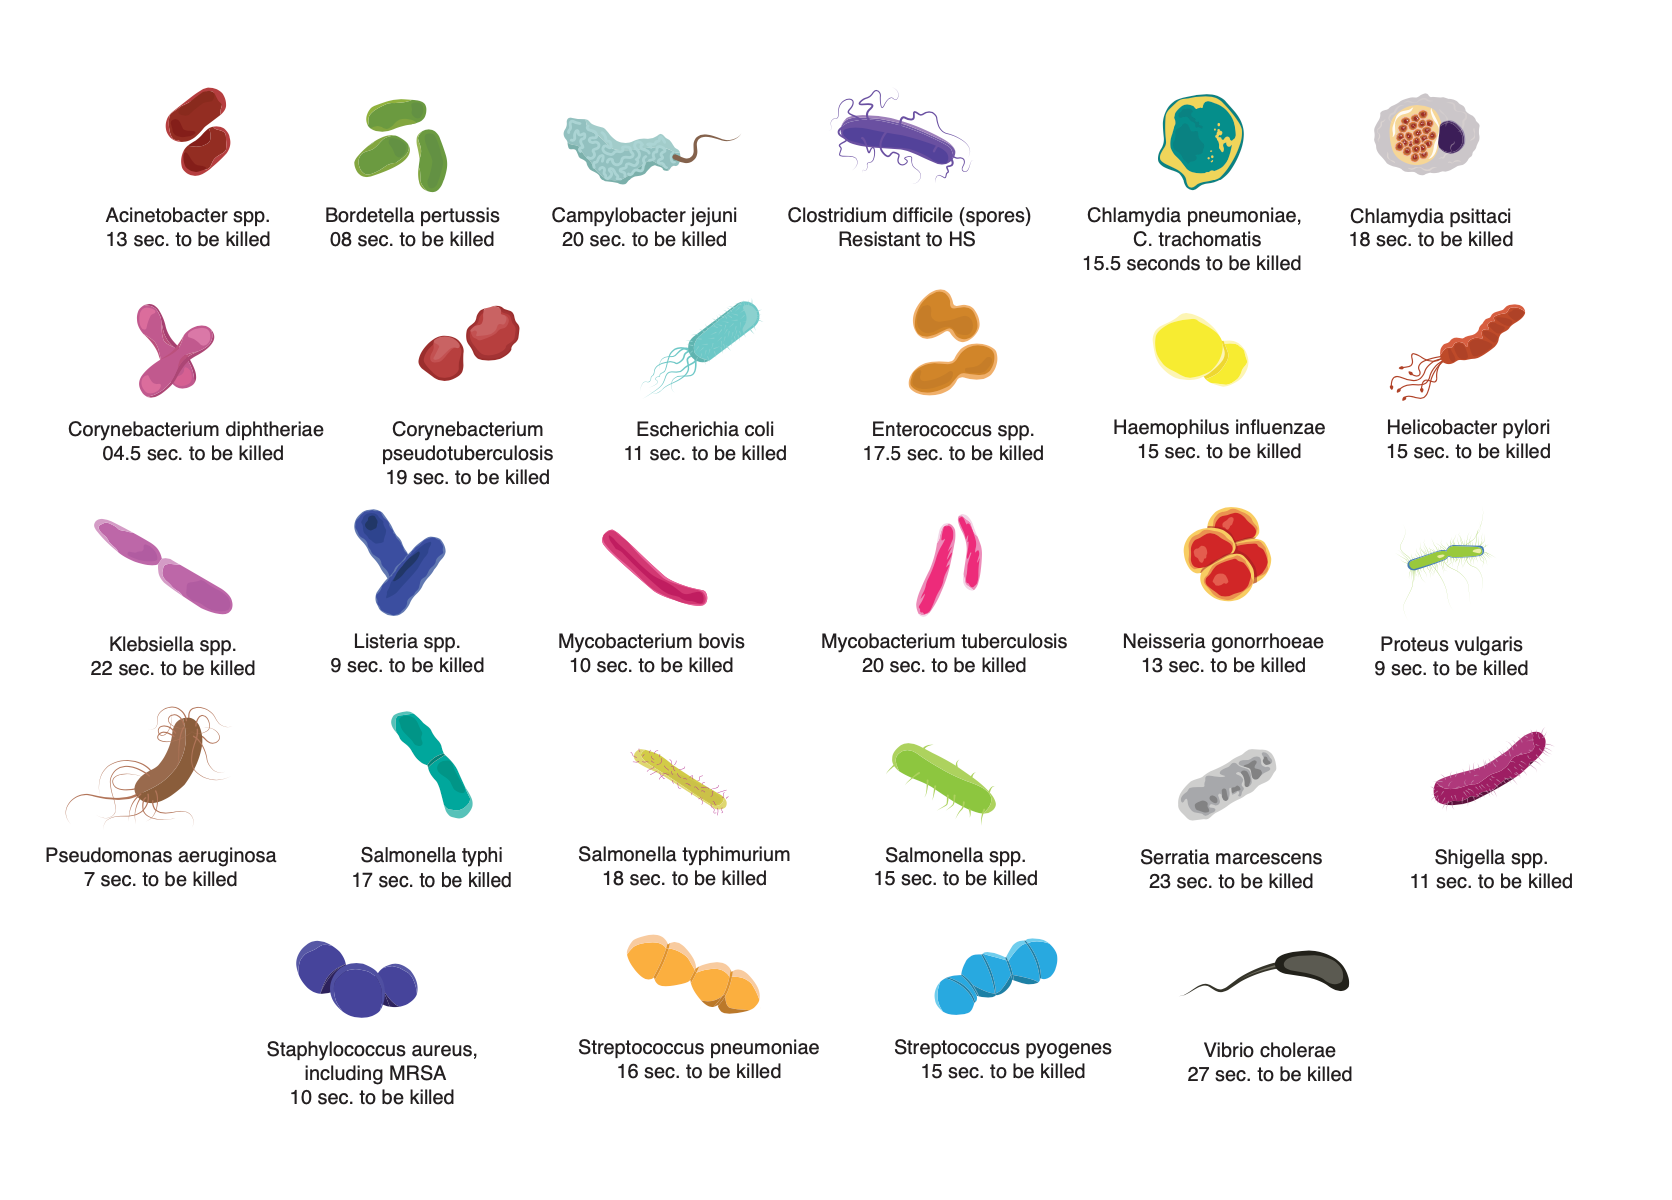
Before creating the final materials, I illustrated each bacterium in the data set
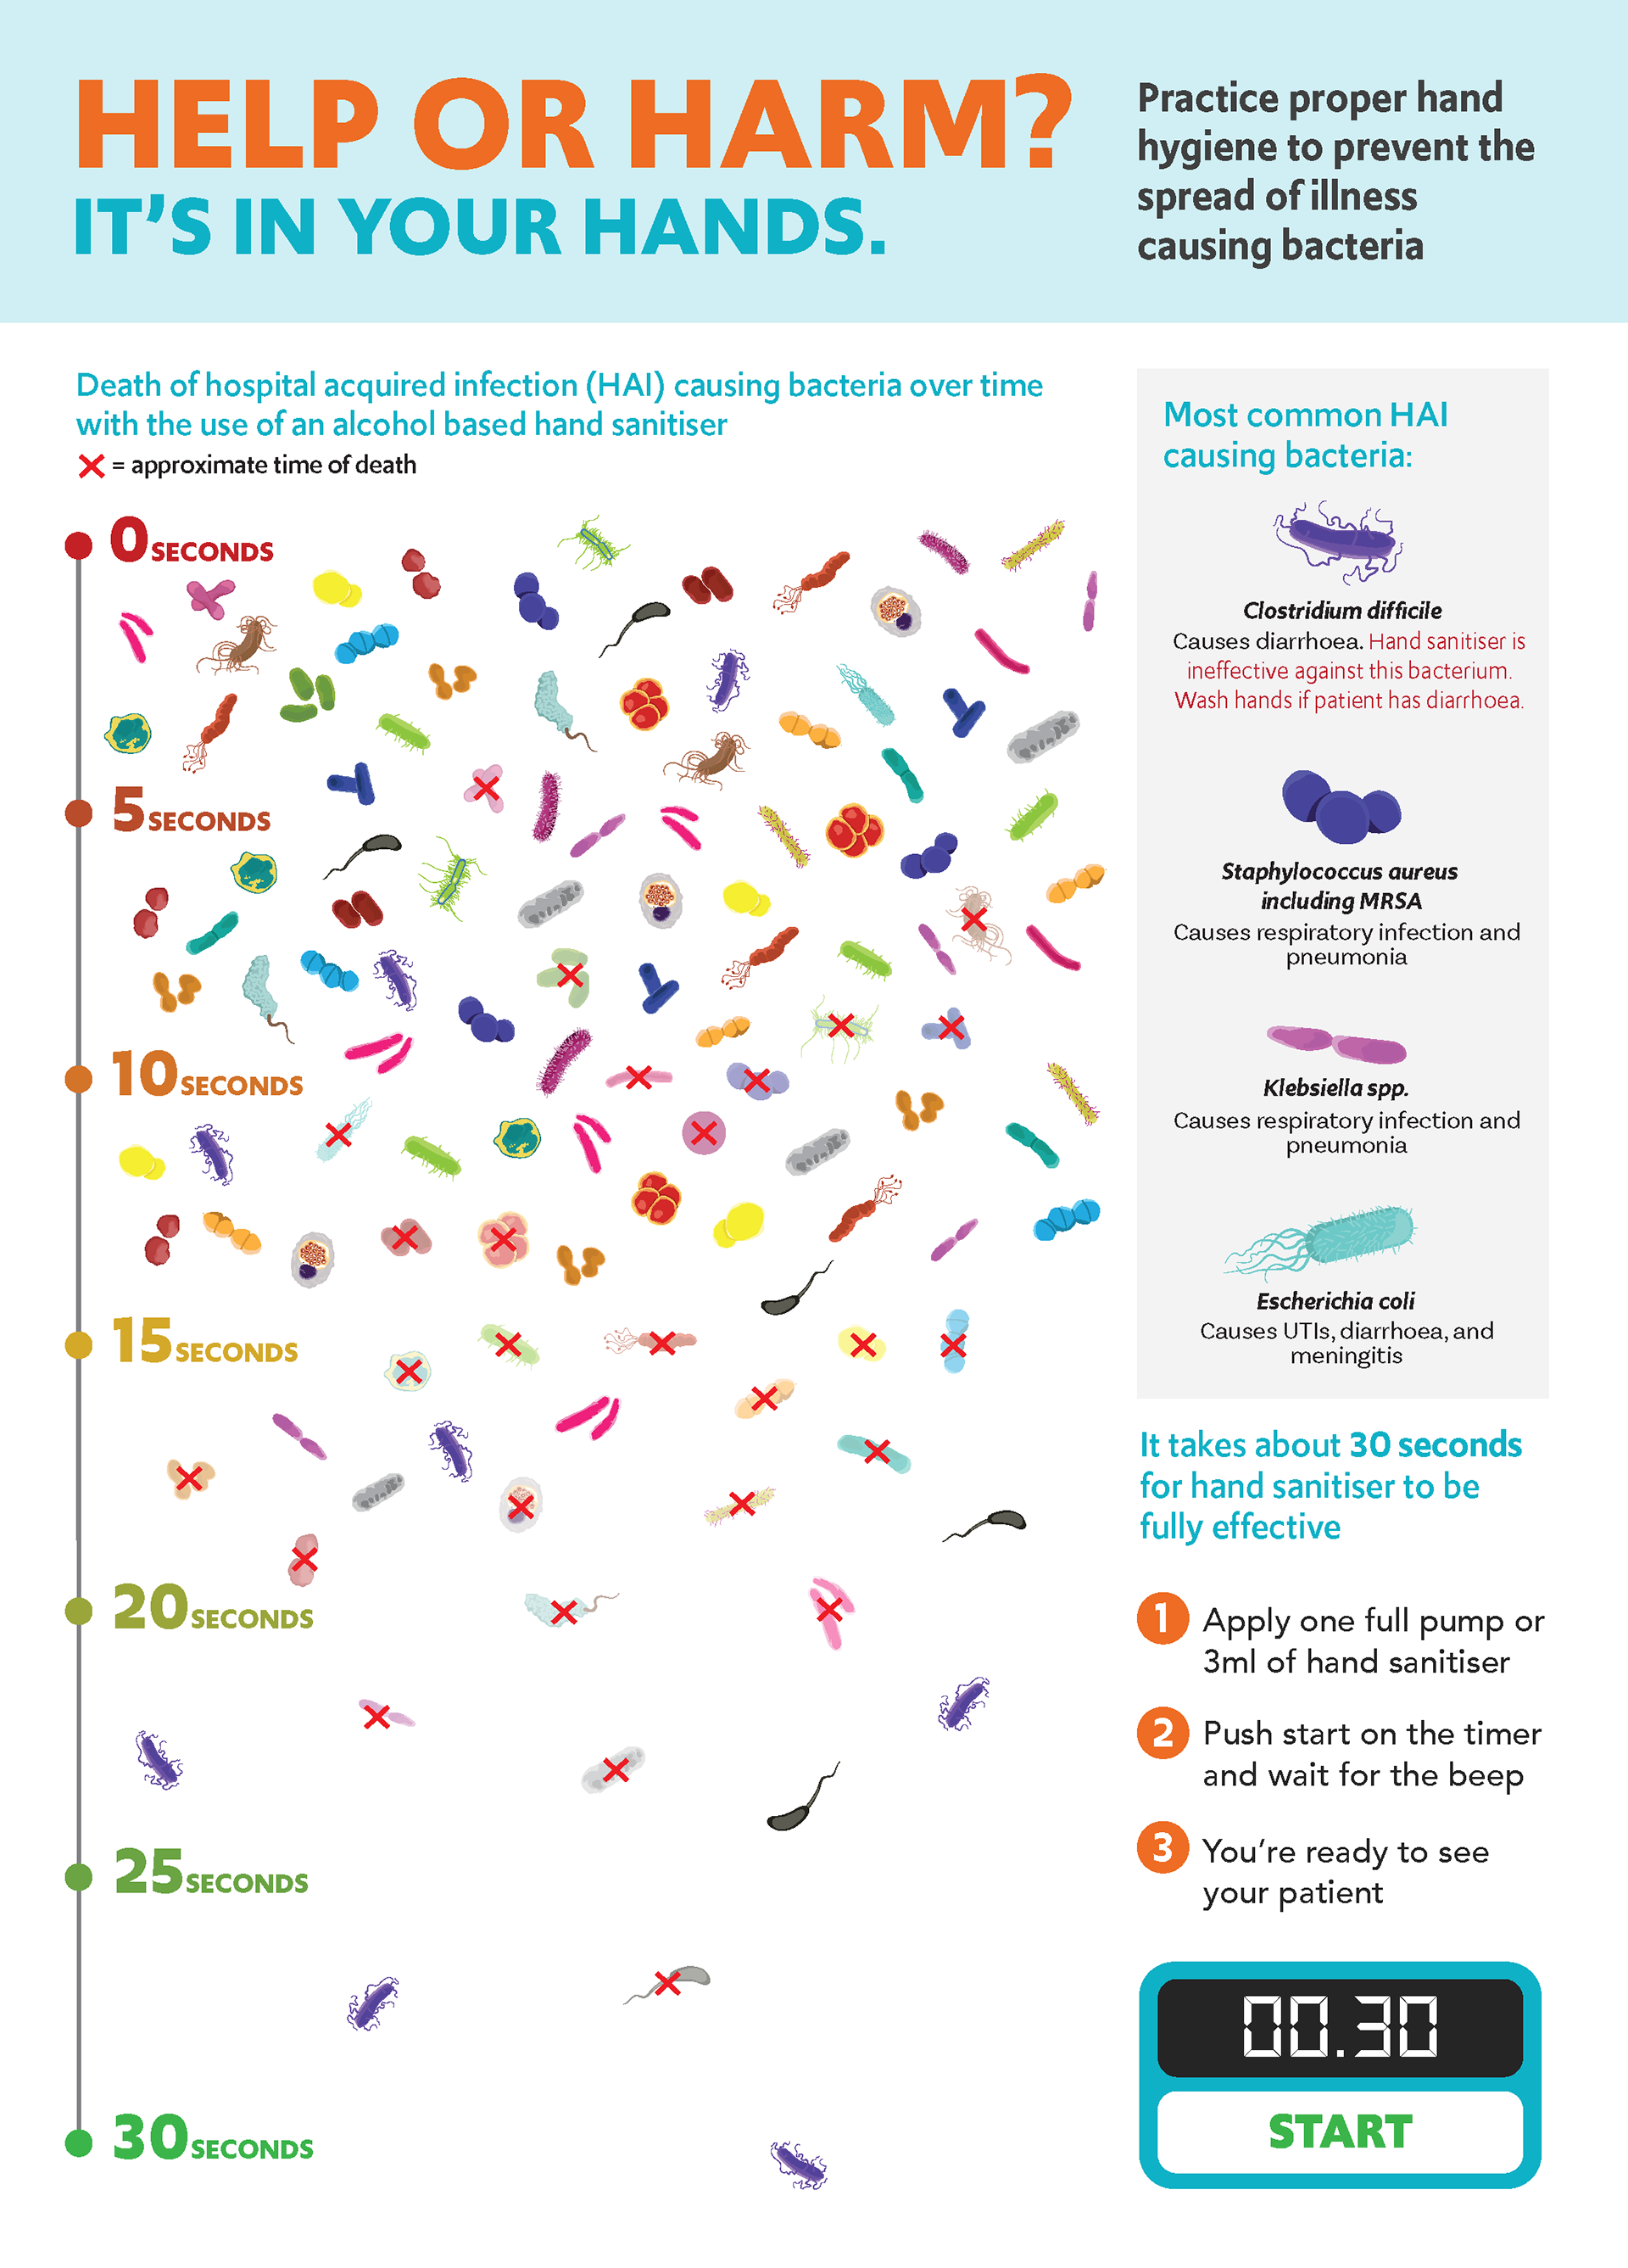
Poster with hand sanitizer countdown timer. This poster is intended to be used by health care workers to ensure that they applied the hand sanitizer for a full 30 seconds.